
First published in The Domain Standard, September 2026
Last June, Michaela Cruden, one of the authors in the previous issue of Domain Standard, invited me to speak at the InternetX Domain Summit at the Fotografiska Museum in Berlin. She asked me to cover a topic related to the domain aftermarket, and I did not have to think twice about which question to bring: are domain names good investments, and how do they perform compared to other asset classes?
The basis for the data is ten years of the Liquid Market Report, a publication I launched in 2016 that covers the most important metrics affecting demand and supply in the market for liquid domain names (the short .com domains, categories like 2L, 3L and 4L, meaning ab.com, abc.com, abcd.com).

The talk coincided with the report’s 10th anniversary, so for the first time I was able to extract ten years of domain name performance and compare it directly with other asset classes.
Is it better to hold domain names, or are you better off holding ETFs, stocks, gold or real estate? If domain names are a legitimate alternative investment class, how do they actually behave?
My talk aimed to answer those questions, and the answers were pretty stark.
Data is the plural of stories. Numbers are numbers, but the tenth anniversary of the Liquid Market Report also gave me a lens on my own story, and on how much this industry has changed in a decade. So this article covers both: the story and the data behind ten years in domain names.
How do you make $1M in 6 months?
I launched ggrg.com in May 2015. The timing could not have been better. I wanted to move away from the usual brokerage, where I saw too many people selling domains with high conviction but with little understanding about their worth.
One of my first clients was Ken O’Brien, a professional sports bettor based in Las Vegas. He was not a domain investor, however. In May 2015 he started accumulating a large portfolio of four letter .com domains, and within six months he had made a cool million dollars in profit.
I wrote an article recounting his story and the evaluation frameworks we used to pick the best 4L .com, called Investing in LLLL.com, A Starter Guide. Around that time I started corresponding with a young Dutch investor called Tim Schoon. He was buying 4L .com and numerics heavily, and he mentioned in passing that he liked to call Chinese premium domains “chips.” I published the term for the first time in my newsletter and it took off. Even the Chinese sites tracking the market started calling them “chips”.
By the time my article came out, the market had gone vertical. A chip bought in March 2015 and sold at floor price in September returned 412%.

In January 2016, at the NamesCon conference in Las Vegas, a man I had never met found me in a club and thanked me. He had bought a house with what he made on four letter domains. The Big Short was in cinemas at the time and the parallel was too obvious to miss. Some investors were certain chips would go to the moon, citing scarcity as their main argument. Others were more cautious, but you could feel the FOMO.
Then it all came crashing down.
The first sign was slowing activity. The first months of 2016 were unusually quiet. The explanation going around was Chinese New Year, since tradition dictates winding down business before and after the holiday. But weeks after CNY the market still showed no sign of recovery.
To make sense of it, a handful of industry old hands organised a call. Nat Cohen, a veteran domain investor, owner of Telepathy and president of the ICA, mentioned in passing:
A market only supported by investors is not sustainable.
That stuck with me, and it is one of the reasons the report exists. Everyone on that call was still wondering which part of the boom had been real. Nat’s sentence turned it into something you could check. If prices had been driven by investors selling to investors, then price was not the thing to measure. The question was what makes a domain valuable in the long term.
Answering that meant asking my close industry friends for help. Ivan Rasskazov, one of the people behind DomainIQ and Estibot, came in. So did Russell Panella, the software engineer behind LLLLSales.com, later ShortNames.com.
Then we did what few people were doing.
We looked into the data.
How do you measure long term value?
At its base the idea was simple. The report had to track the metrics that could tell you which domains were genuinely in demand from end users, and which were mostly circulating among investors and therefore more susceptible to speculation.
Some of these are lead indicators, the ones I believed would have predictive value for a category. Others are lag indicators, which tell you what is happening in a category right now. The report tracks both.
The main lead indicator was the development index: the percentage of domains in a liquid class that are actually developed, meaning the address resolves to a working site rather than sitting parked or idle. It works as a two sided measure.
A high development index shows the category has been in demand from end users. It is human nature to want a brand that looks familiar, so once businesses are established in a neighbourhood, other businesses want to be there too. Consider that different extensions offer almost no practical utility over one another, yet .com is worth several multiples of .net.
Why? Familiarity.
The same number also tells you something about supply. A domain owned by an end user is a domain that is generally not for sale, so the more of a category is in use, the less of it is available.
There were two other lead indicators we tracked and later abandoned. The first was the concentration index, a measure of how spread out the owners of a category are. The theory was that many owners means many rational players each trying to make the best of their holdings, while a category where one person owns 20% of the inventory is far more exposed to wild swings, or even pump and dump schemes.
The second was geographic distribution, how a category was split between the US, Europe, China and the rest of the world. That started as pure curiosity, though at the time it was fairly well established that most end users were in the US. I also wanted to see how much investable inventory was moving from the West to China.
We had to scrap both in later editions. Changes to the way WHOIS privacy data was displayed made the underlying ownership information impossible to collect reliably.
The lag indicators were the classic ones: volume of sales, category turnover, and the 5th percentile, our measure of the floor price. We later added Escrow.com and their quarterly sales data, which was a valuable addition. ShortNames eventually stopped operating, and we welcomed Michael Sumner of NameBio, by then a staple tool for any domain investor.
Do domains beat the market?
The theory was that domains with a higher development index would hold their value better over time. Ten years of data later, we can finally check it.
But there is a deeper and more fundamental question underneath. If you have limited capital, why put it into domain names rather than something else? Domains are a peculiar asset. They are relatively liquid by the standards of private markets but deeply illiquid by the standards of public ones. There are transaction costs, time and management, UDRP risk, and renewals.
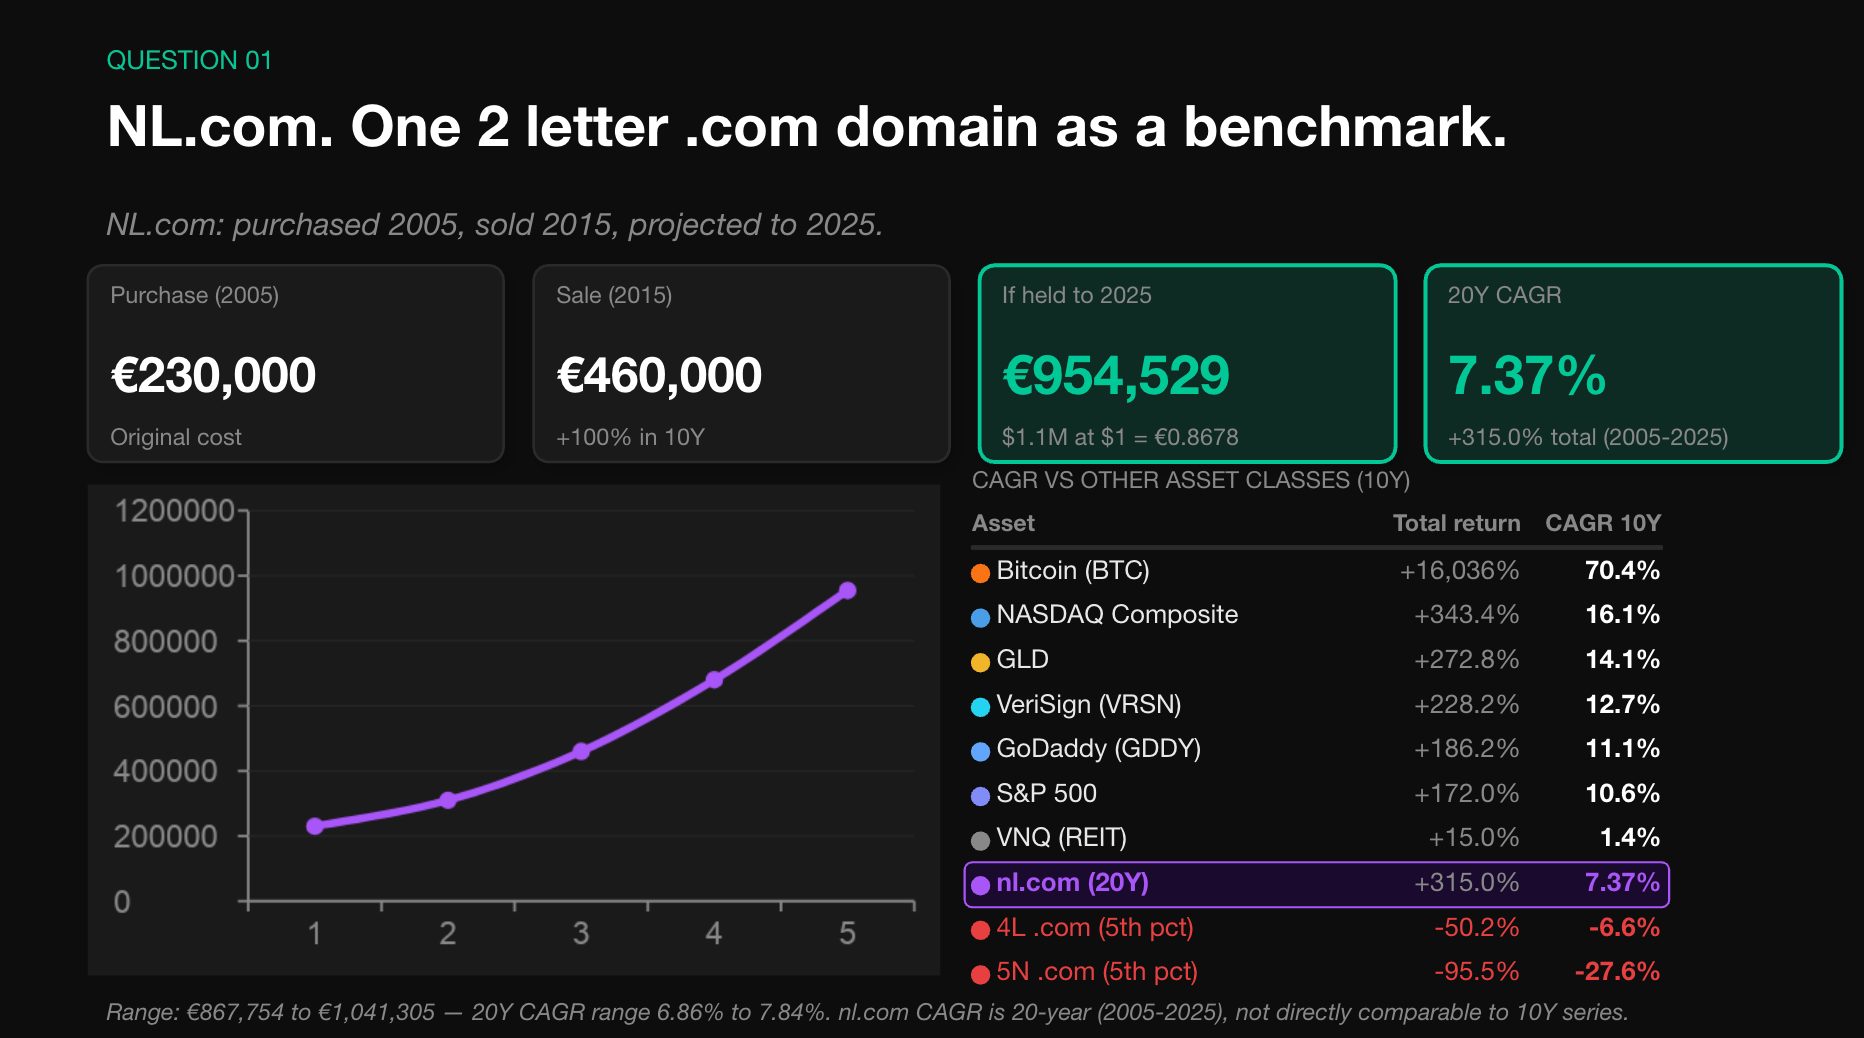
Let’s start with a single domain. In The Breakfast Club I wrote about nl.com. Hennie Groot Lipman, an industry veteran, recently wrote me:
I bought NL.com a long time ago for 230K euro. Ten years later I put it up for auction and it sold to another domainer for about double the price. Outsiders say: “Wow, you made 230K. That’s fantastic!” I say: “I made 7% per year (compounded interest) which is not enough for a risky investment.”
Seven per cent a year on one of the best two letter .com domains in the world. Over a comparable window the S&P 500 compounded at 10.6%. Gold did 14.1%. The NASDAQ did 16.1%. Bitcoin did 70.4%.
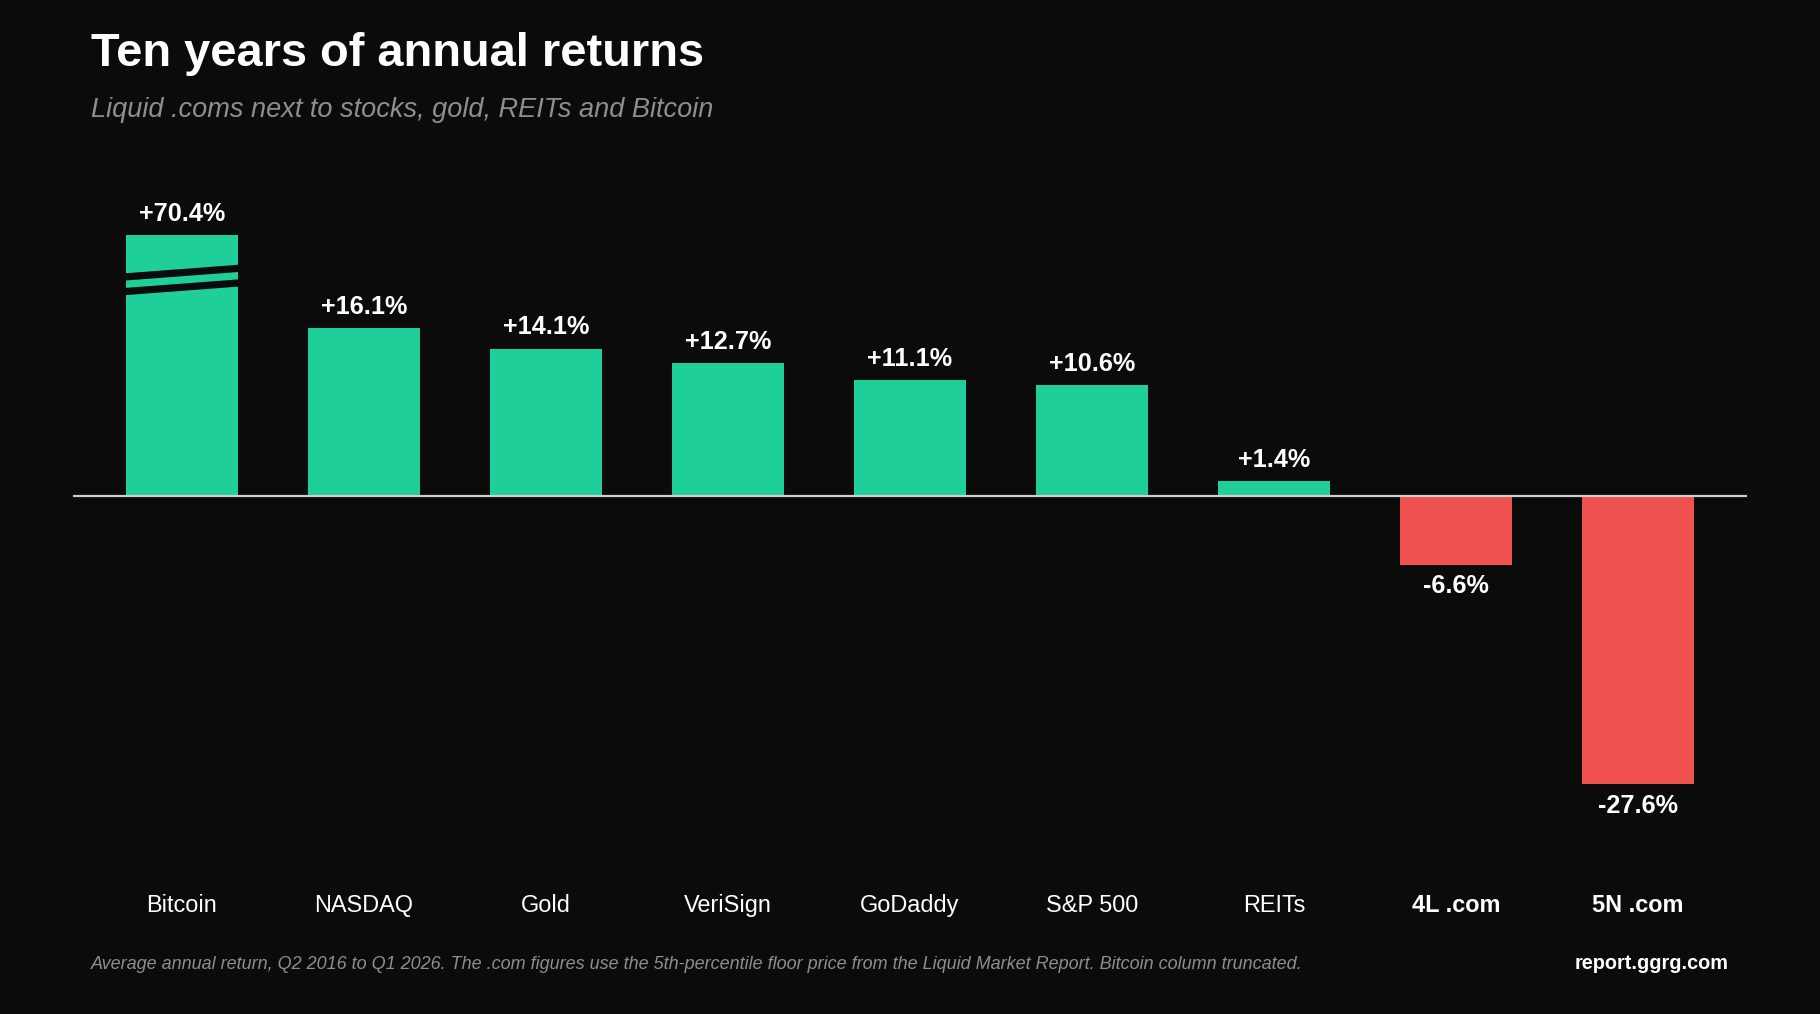
Now put the liquid categories next to them.

Over the ten years the report has been running, the 4L .com floor price fell 50.2%, an annualised -6.6%. The 5N .com floor fell 95.5%, an annualised -27.6%. Both were beaten by every financial asset on the chart, including a REIT index that barely moved but pays quarterly dividends.
So the development index did what I expected, just not in the direction I was hoping for. The most developed category on the board returned around 7% a year. The least developed lost 95% of its floor. The theory held. The asset class did not.
What does this mean for you? If you held liquid domains as a passive investment over the past decade, you likely underperformed almost everything else you could have bought.
But that is the floor price talking, and the floor is the investor-to-investor price. It is not the whole picture. End user sales happen at multiples of the floor, and an investor who regularly sells to end users has significantly different returns. Measuring that properly needs a more sophisticated analysis than a percentile can give you.
It also runs into the nature of the asset. Each domain name has its own demand curve, its own buyer somewhere, its own moment. The market is prone to survivorship bias, to lucky breaks, and to its own incentives about which outcomes get publicised. That is why you will see stories of people doing very well while the index goes sideways.
You hear about the big sales. You do not hear about the portfolios that are quietly underwater.
The stories are not the whole picture, but they shape how the market is perceived. That’s why it matters who does the telling. When the report hit its tenth anniversary, Ron Jackson covered it in DNJournal. Ron has been recording the stories of this industry for longer than most of us have been in it, the sales, the exits but also the people, and he gets nowhere near the credit he is owed. For me, reading DNJournal was a big part of why I joined the industry. These stories and the personal connections are why people stay. Ken O’Brien and the six months that made him a million. The man in the club in Las Vegas who bought a house.
No percentile is going to capture that. But the stories should not be why people arrive. If you are coming into this market now, start with the data.
As in any endeavour, it takes skill, effort and experience to beat the market. It always has.
This article is not investment advice. The data is aggregated on a best effort basis and no guarantee is made as to its accuracy.
Read the latest Liquid Market Report: https://report.ggrg.com
One response to “Do Domains Beat the Market? A Decade of Data”
[…] In addition the latest quarterly report, The Domain Standard has just released a new issue (#6 in the series) featuring a can’t miss new article from Giuseppe – Do Domains Beat the Market? A Decade of Data. Giuseppe said, ” I was able to extract ten years of domain name performance and compare it directly with other asset classes. Is it better to hold domain names, or are you better off holding ETFs, stocks, gold or real estate? If domain names are a legitimate alternative investment class, how do they actually behave? The article has the intriguing answers and, in addition to the link above to the print version from The Domain Standard (an outstanding publication from Freename), you can read it on the GGRG.com website. […]